
Using the Vitals Trends View
The Trends view plots a patient's vital readings over time, so you can see direction and variability at a glance instead of reading values row by row. It covers every vital in the flowsheet, including the custom vitals your practice defines, and pairs the chart with a table of the readings behind it.
Opening the Trends View
- Open a patient's chart.
-
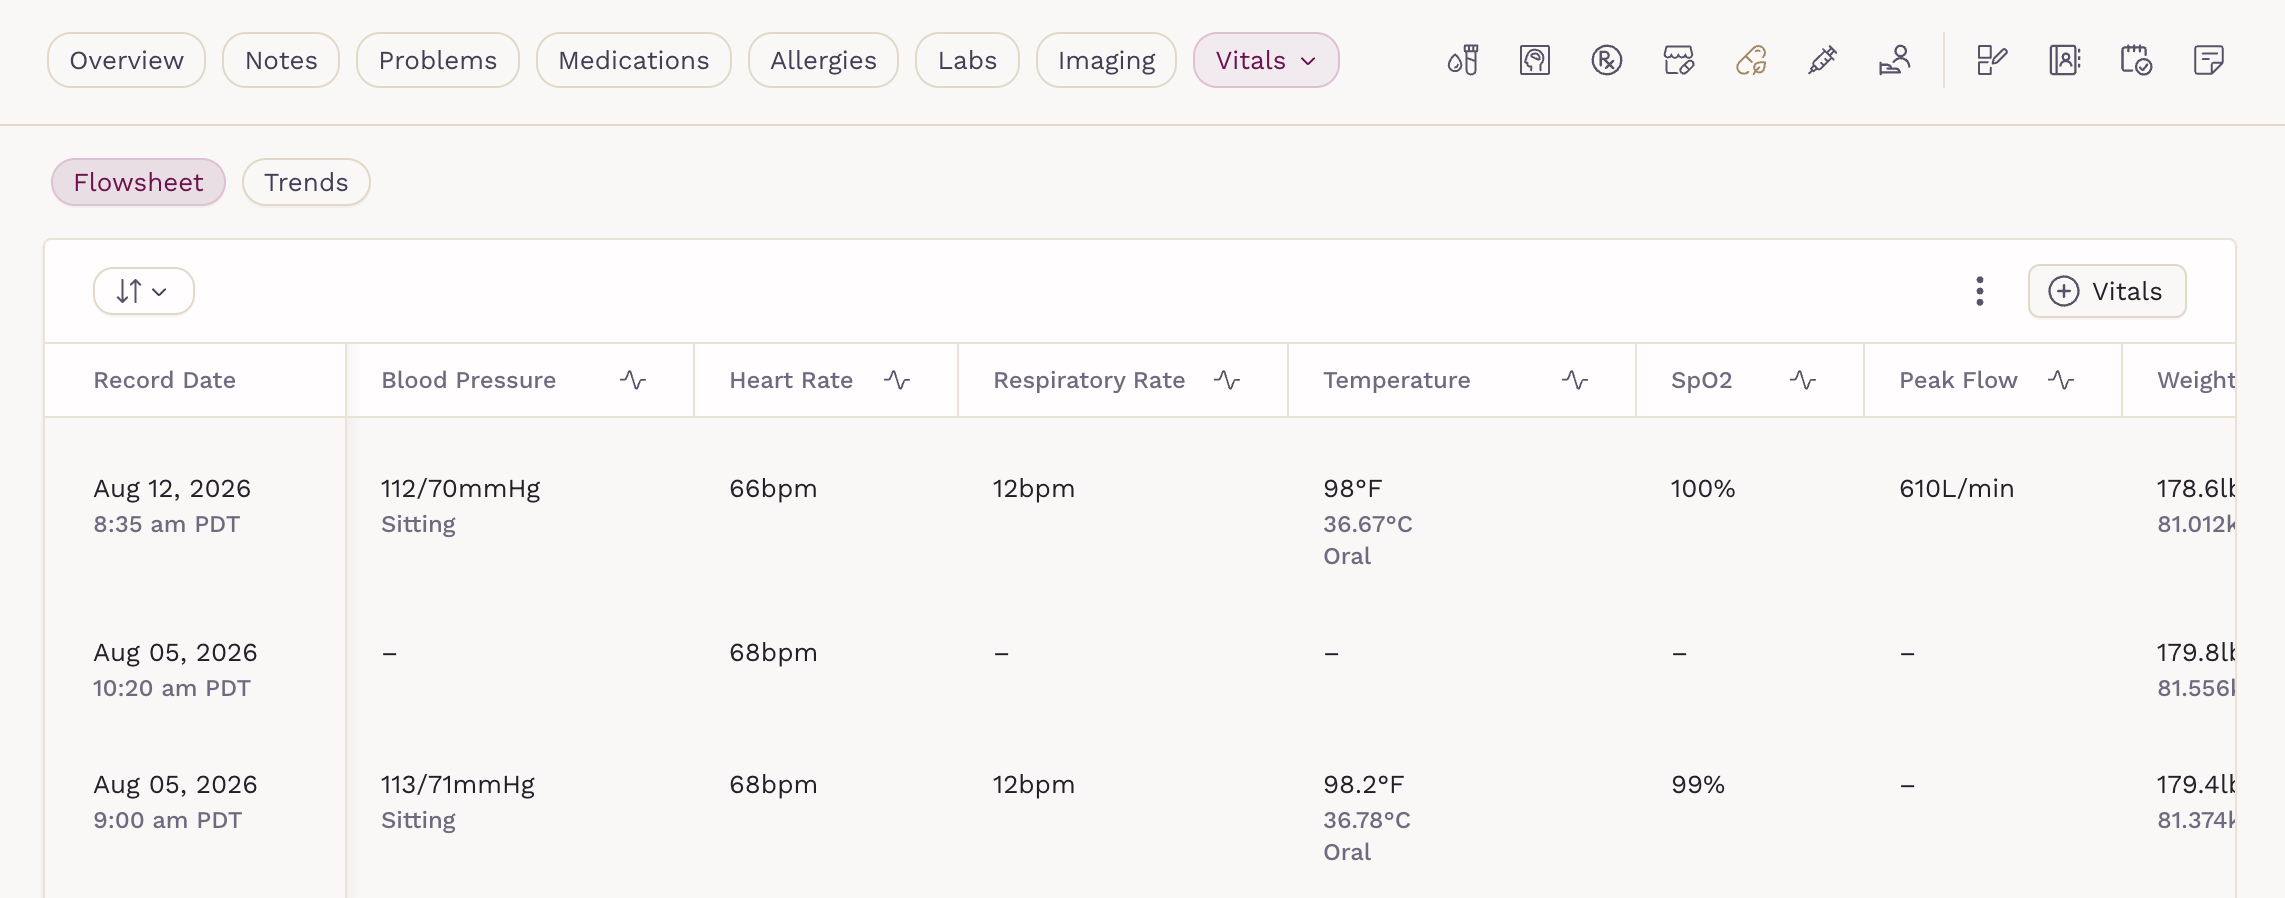
Go to the Vitals section.
-
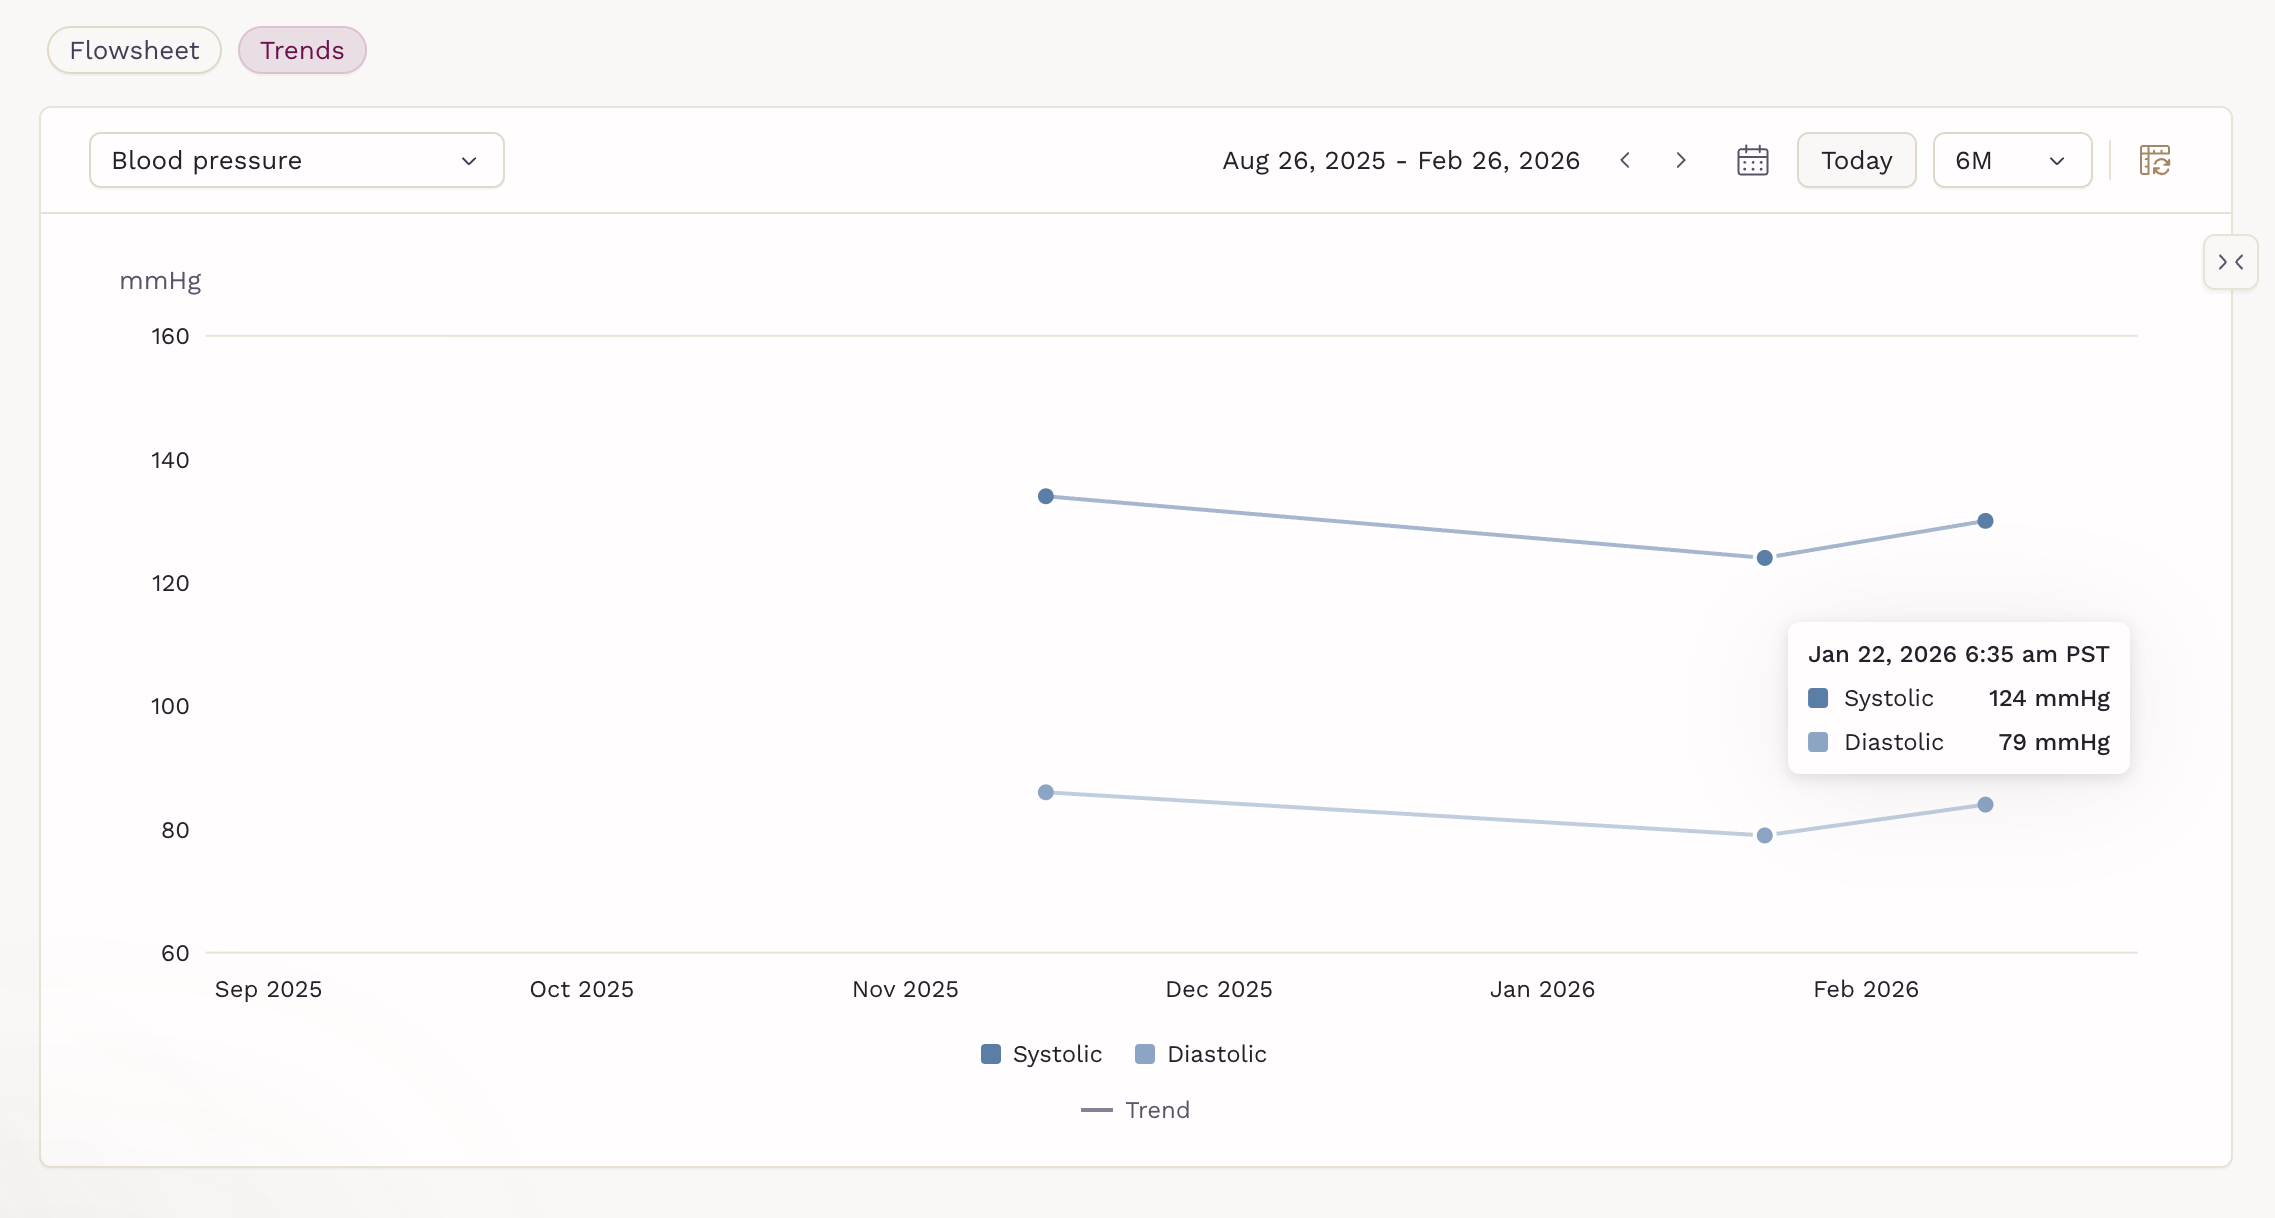
Click on the Trends tab. The view opens on Blood pressure.
You can also open Trends for a specific vital from the flowsheet. Hover the vital's column header and click the chart icon (View trend). Trends opens with that vital selected and the period reset to the most recent one.

Choosing a Vital
The first dropdown lists every vital available for the patient:
- Blood pressure
- Heart rate
- Respiratory rate
- Temperature
- SpO2
- Peak flow
- Weight
- Height
- BMI
- Head circumference
- Waist circumference
- Hip circumference
- Waist/Hip
- Waist/Height
Any active custom vital your practice has created appears in the same list, below the standard vitals. Archived custom vitals are not listed.

Comparing Two Vitals
The Compare with dropdown overlays a second vital on the same timeline, such as weight against BMI, or heart rate against SpO2.
The comparison vital is drawn in purple and reads against its own axis on the right side of the chart, with its unit shown above it. Both lines stay readable even when the two vitals use very different scales.

- Compare with is available for single-line vitals only. It is hidden while Blood pressure is selected, and blood pressure cannot be chosen as the comparison vital.
- Changing the primary vital clears the comparison.
- To remove the comparison, clear the dropdown.
Setting the Time Period
The toolbar above the chart controls which stretch of time you are viewing. The current period appears on the left, for example Feb 26, 2026 - Aug 26, 2026 .

- Window length sets how much time the chart covers: 1D, 1W, 1M, 3M, 6M, 1Y, or All. New charts open on 6M. Your selection is saved per practice in the browser you are using, and applies to the next chart you open.
- Previous period and Next period move the chart one full window backward or forward. Next period is unavailable once you reach the current period.
- Go to date opens a calendar. The window ends on the date you select, and future dates cannot be selected.
- Today returns to the current period. It is unavailable when today already falls inside the period you are viewing.
- Selecting All plots every reading on record. Period navigation and Today do not apply.
Switching Units
The unit icon at the end of the toolbar switches the chart between Imperial and Metric.

It applies to vitals recorded in both systems:
- Temperature
- Weight
- Height
- Head circumference
- Waist circumference
- Hip circumference
The icon is unavailable for vitals with a single unit, such as heart rate or BMI.
The chart opens in the unit system set in your personal preferences. Your last selection is saved per practice in the browser you are using.
Reading the Chart
Each reading appears as a dot, connected by a line. The key below the chart explains what you are seeing:
- Trend — a solid line between consecutive readings.
- Reading gap — a dashed line spanning a stretch with no readings. It appears when the interval between two readings is much longer than the patient's usual recording cadence.
- Thresholds — a shaded green band showing your practice's normal range for the patient's age and sex at birth.
Threshold bands require a date of birth and a sex at birth on the chart, and a matching threshold configured in your practice's vital thresholds. Bands follow the patient's age, so the band shifts across the plot as the patient ages through a threshold's age range. Custom vitals do not have thresholds and do not show a band.
Hover a dot to see the date and time the reading was recorded, along with its value. When more than one reading shares the same timestamp, all of them are listed.

The chart needs at least two readings to draw a line. When it cannot, one of three messages appears:
- Not Enough Readings — the patient has a single reading in this period. Try a longer window.
- No Readings in This Period — no readings were recorded in this period. Move to a later period or choose All.
- No Readings in This Range — the patient has no readings for this vital in the range covered.
Using the Records Table
The panel on the right lists the readings behind the chart, most recent first. Use Hide table and Show table to collapse or reopen it. The state is saved for the next time you open the view.

The table has two columns:
- Recorded On — the date and time of the reading.
- Reading — the value, with the alternate unit below it for vitals recorded in both systems.

A reading outside your practice's normal range for that patient is marked with a warning icon. Hover it to see which threshold was crossed. Thresholds are evaluated against the reading as it was recorded, so switching units on the chart does not change which readings are flagged.

The table lists the readings inside the selected period, and follows the vital and period you have chosen. A blood pressure reading recorded with only one of its two values is left blank.
On narrower screens, the records table collapses automatically while a note side panel is open. Reopen it once the side panel is closed.